

Visualise what matters: Custom Dashboards for effective environmental monitoring
01 May 2025
Share


![]()
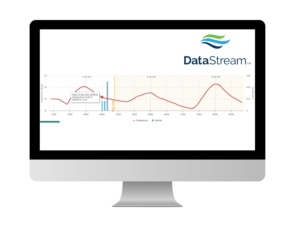
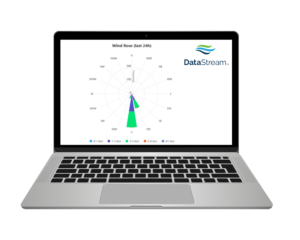
HydroTerra’s data visualisation platform – DataStream – offers a powerful and flexible way to keep an eye on your environmental monitoring data in near real time.
Whether you’re visualising sensor data, derived operational metrics, compliance indicators, or a blend of environmental measurements, our platform enables clear and actionable interpretation through customisable, interactive dashboards. From standard time series charts and gauges to fully customised dashboards tailored to your site and application, we provide tools that help you quickly interpret trends, identify anomalies, and support your compliance reporting and event-driven action.
We can configure dashboards and widgets to suit project needs, filter datasets over time or by location, and overlay different datasets for comparative analysis. Visualisation options can be scaled from simple site dashboards to comprehensive multi-site monitoring displays, enabling both field staff and technical teams to access insights relevant to their role.
Our platform is browser-based, requires no software installation, and integrates seamlessly with our environmental monitoring systems as well as third-party data sources, including external APIs such as weather forecasting services. Our experienced team specialises in handling data from a wide range of sources and formats, and we can work with you to build an environmental monitoring solution that integrates and unifies diverse datasets.
If you’re looking to get more value out of your data and present it in a way that supports better environmental management—HydroTerra has you covered.
Let us help you visualise the bigger picture.
Learn more about DataStream