

Rehydration heat map project unearths valuable data sets
21 June 2022
Share


Imagine being able to identify landscapes with the highest potential to benefit from the adoption of rehydration practices along their natural waterways. HydroTerra is part of a collaborative effort to do just that! Our long association with The Mulloon Institute (TMI) has led to this exciting project, supported by the NSW Department of Primary Industries (DPI), to develop a selection tool that serves to rank the catchments throughout NSW on an interactive spatial model, akin to a ‘heat map’. The model will allow selection of sub catchments which are likely to benefit the most from implementing landscape rehydration practices which have proven successful at Mulloon Creek and other catchments across Australia.
An outline of evaluation frameworks for the selection tool
Rehydration of landscapes is achieved through the strategic implementation of leaky weirs along creek and river systems. These weirs moderate and maintain water to continue to flow through the system, while increasing available soil and ground water in the landscape for agriculture production, native flora and fauna, and recreation.
Degraded landscapes can be rejuvenated through the adoption of rehydration practices at catchment scale, benefitting farmers, regional communities, and the environment. For investors and government agencies who want to prioritise resources for encouraging practice-change in this space, the selection tool model will provide an invaluable high level guidance on catchment regions that warrant further attention.
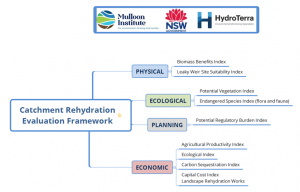
The heat map project has recently completed the initial phase which was to develop a conceptual approach and draft model specification. With help from practitioners at TMI, HydroTerra has obtained the assistance of subject experts to establish the most important indicators of catchment conditions, structured around key evaluation frameworks (as illustrated in the diagram below). The experts have then assisted in finding the available spatial datasets (layers) which inform on the desired indicators and can be used as inputs to the selection tool model.
After much deliberation between the team and subject matter experts, a selection of datasets has been identified for the physical, ecological, planning (regulatory) and economic frameworks. The project has revealed some impressive spatial layers available from State and Federal agencies like the Bureau of Meteorology, Geoscience Australia, CSIRO, NSW DPE, NSW DPI and more. The diagram below is an example of a conceptual approach to the use of layers along the riparian zone and flood plains for indicators of vegetative condition and biodiversity status.
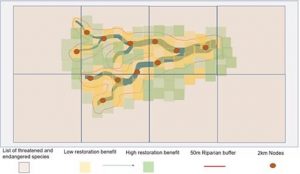
Conceptual model of the ecological layers
The draft specification of the selection tool model provides for flexibility in the scale of catchment evaluation and ranking. Source data indicators, and resulting weighted indices used for ranking catchments, are to be processed at the level of ‘nodes’ located at 2-kilometer intervals along catchment waterways. Users of the heat map model will be able to select the desired scale of evaluation, the model will aggregate node values and presents catchment rankings in a colour coded map.
The next phase of the project is focused on developing the model – integrating the data layers and develop rankings for the model output.
HydroTerra and TMI are grateful for the assistance provided by subject experts from many organisations and look forward to continuing the collaborative effort in building the model.